
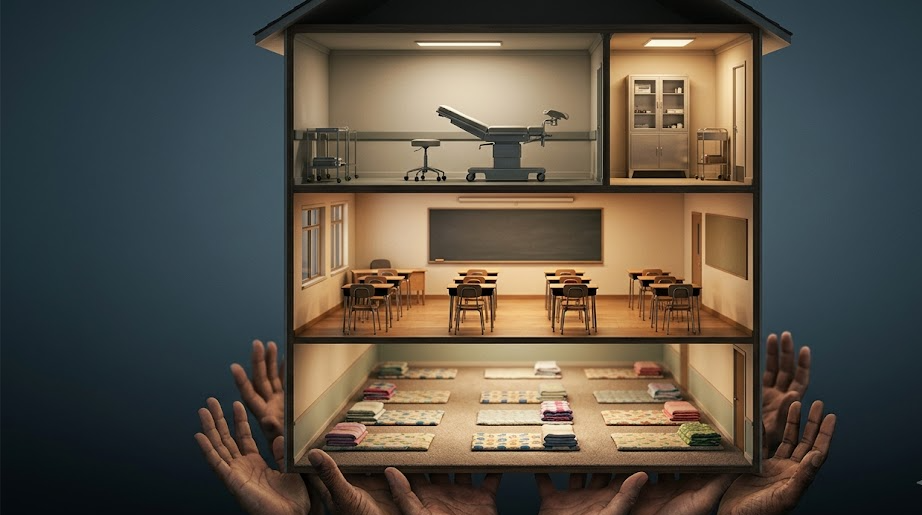
When patients pay at a hospital counter, what they see is only the money they hand over themselves. The share covered by national health insurance is recorded as a single line on the receipt. The "Results of Income Statistics Reflecting Social Transfers in Kind," released by the National Data Office (국가데이터처) on the 18th, converted that share into income. In 2024, the value of the services a household received in this way averaged 9.26 million won, or 12.5% of household income.
Social transfers in kind refers to welfare that the government provides as services and goods rather than cash. Free education, free child care, free school meals and health insurance coverage of medical costs are included here.
When this share was added to income, inequality indicators moved noticeably. The Gini coefficient fell 0.044, from 0.325 to 0.281, and the relative poverty rate dropped 4.8 percentage points, from 15.3% to 10.5%. That means nearly five out of every 100 households rose above the poverty line thanks to the services they received. Adjusted household income was 83.53 million won, up 3.0% from a year earlier.
By quintile, households in the bottom 20% of income, the first quintile, received 7.27 million won in in-kind welfare a year, while the top 20%, the fifth quintile, received 12.53 million won. The absolute amount grows the higher up the scale. Yet the share this amount takes up in each group's household income runs the other way. It is 46.8% for the first quintile and 7.2% for the fifth.
For a household that lives on 15.52 million won a year, 7.27 million won worth of services comes close to half of its household budget. For a household earning 173.38 million won, 12.53 million won is one part in fourteen.
What they receive also differs by quintile. Health care accounts for 88.0% of the in-kind welfare received by the first quintile. For the second quintile, 67.1% was health care as well.
For the fifth quintile, education is the largest at 57.0%, and for the fourth quintile education is 51.3%. Households lower down receive support in health care, and those higher up in education.
Broken down by the age of the household head, the gaps in amount are large. Households headed by someone in their 40s receive the most at 14.99 million won, followed by those in their 50s at 9.74 million won, those 60 and older at 7.97 million won, and those 39 and younger at 5.72 million won. Households headed by someone in their 40s also show the highest ratio to household income at 16.1%.
State support is concentrated in the years when there are children in school. Child care is relatively large among households headed by someone in their 30s or younger, and health care among those 60 and older.
The amount grows as the number of household members rises. It jumps from 3.54 million won for one-person households and 6.73 million won for two-person households to 19.14 million won for four-person households and 30.19 million won for households of five or more. In households with more than four members, education and child care account for more than 70% of in-kind welfare.
Breaking the total of 9.26 million won down by sector, health care is 4.88 million won (52.8%) and education 3.77 million won (40.7%). Together they come to 93.5%. Child care is 320,000 won (3.5%), and vouchers and other items 280,000 won (3.0%).
Compared with the previous year, health care rose 3.5% while education fell 3.4% and child care 7.2%. That is the background to the overall increase staying at 0.4%.
No explanation was attached to this release as to why education and child care declined. Whether it reflects a change in the school-age population or the effect of a program overhaul can be sorted out only by looking separately at spending by sector.
Debates over the welfare budget usually revolve around the size of expenditure line items. These statistics show what that spending looks like after it has flowed into households. Adding up support that had been scattered across health care, education and child care comes to one-eighth of a household's annual income.
The finding that 88% of the in-kind welfare received by first-quintile households is health care shows which group is shaken the most when the scope of health insurance coverage narrows even slightly.
Once the time series contained in the release accumulates over several more years, it will become possible to track which items in which quintiles move each time a program changes. In this year's statistics, alongside the scale that looked only at cash income, a scale that adds the value spent on medical care, education and child care has been set down as well.